


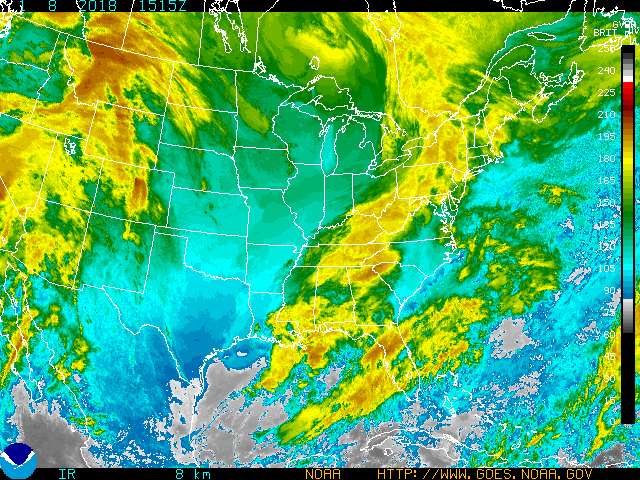
GOES Eastern US SECTOR Infrared Image
Color enhanced imagery is a method meteorologists use to aid them with satellite interpretation. The colors enable a meteorologist to easily and quickly see features which are of special interest to them. Usually they look for high clouds or areas with a large amount of water vapor.
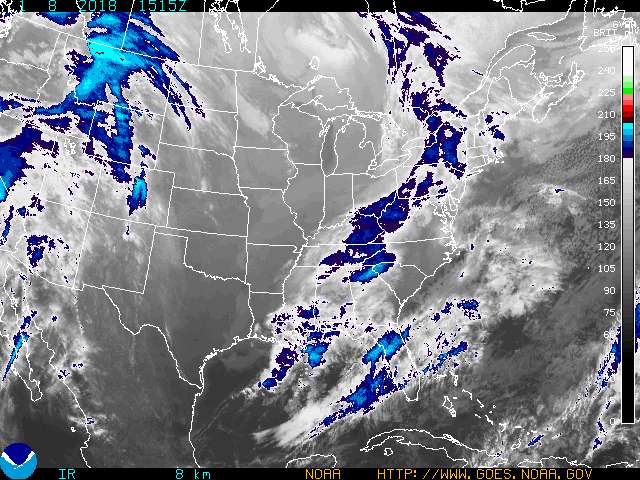
In an infrared (IR) image cold clouds are high clouds, so the colors typically highlight the colder regions. In a water vapor image, white areas indicate moisture and dark areas indicate little or no moisture, so the colors typically highlight areas with large amounts of moisture.
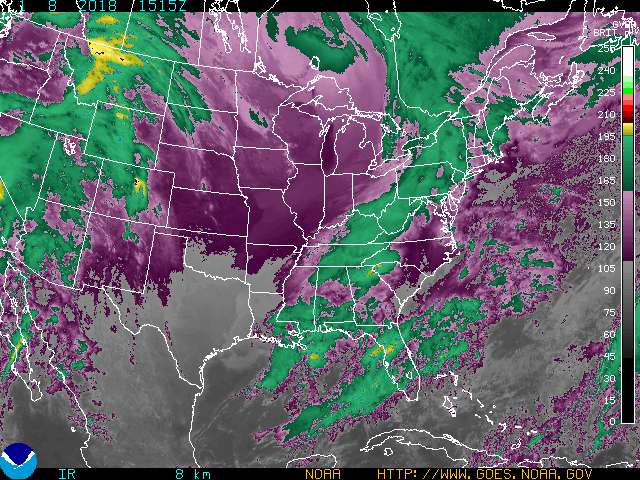
For IR images, the bar on the right side of the image indicates the pixel brightness values for the corresponding color. The temperature can be determined from the following formulas:
T = 418 - B
or when B <=176
T = 330 - (B/2)
Note that the resulting temperatures are in Kelvin.
For IR data, the highest pixel values correspond to the coldest temperatures.
|
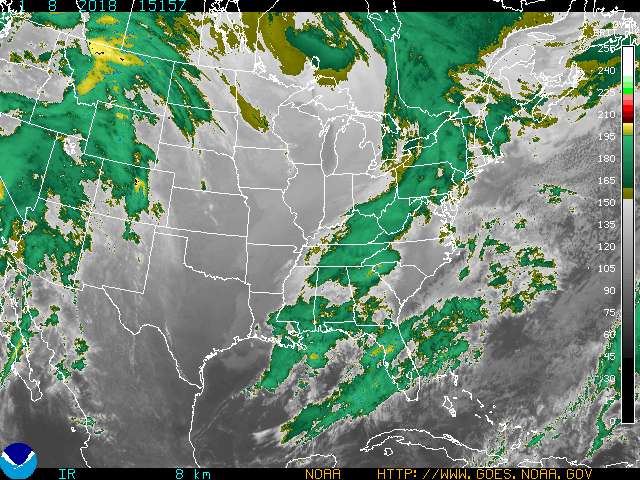
Eastern Conus Sector (Infrared Channel)


Brought to you by the DreamScape digital studios

Email: fourpaws3@yahoo.com